About Us
Our Story
The district census report is the first of its kind since the first post–independence census was conducted in 1960. The report provides basic information about the district. It gives a brief background of the district, describing its physical features, political and administrative structure, socio–cultural structure and economy. Using data from the 2010 Population and Housing Census (2010 PHC), the report discusses the population characteristics of the district, fertility, mortality, migration, marital status, literacy and education, economic activity status, occupation, employment; Information Communication Technology (ICT), disability, agricultural activities and housing conditions of the district. The key findings of the analysis are as follows (references are to the relevant sections of the report):
Population size, structure and composition. The population of Sissala West District, according to the 2010 Population and Housing Census, is 49,573 representing7.06percent of the region’s total population.Males constitute of 48.7 percent and females represent 51.3 percent.The population in Sissala West Districtlivedin rural areas. The district has a sex ratio of 94.5. The populationof the district is youthful (45.2%) depicting a broad base population pyramid which tapers off with a small number of elderly persons (population aged 60 years and above).The total age dependency ratio for the district is 102.4.
Fertility, mortality and migration. The Total Fertility Rate (TFR)for the District is 4.3 which is higher than the Regional average of (3.5). The General Fertility Rate (GFR) is 124.0 births per 1000 women aged 15–49 years which is thesecondhighest for the region.The Crude Birth Rate(CBR)is 28.2 per 1000 population.The crude death rate for the district is 7.5 per 1000. Accident/violence/homicide/suicide accounted for 3.8 percent of all deaths while other causes constitute 96.2 percent of deaths in the district. Majority of migrants 20.8 percent living in the District were born in another regionwhile 79.2percent were born elsewhere in the Upper West Region.For migrants born in another region, those born in Greater Accraconstitute 30.2 percent followed by Ashantiregion with 28.3 percent andBrong–Ahafo, 22.3 percent.
Household Size, composition and structure. The District has a household population of 49,021with a total number of 7,116 households. The average household size in the District is 1.4persons.Children constitute the largest proportion of the household structure accounting for 48.4 percent. Spouses form about 9.7percent. Nuclear households (head, spouse(s) and children) constitute 18.1percent of the total number of households in the district.
Marital status. Overall, a little above half (52.7%) of the population aged 12 years and older are married, 38.9percent have never married,0.5percent are in consensual unions, 6.2percent are widowed, 0.6percent are divorced and 1.2percent are separated. By age 25–29 years, over eight in ten of females (83.6%) are married compared to married males (50.6%).At age 65 and above, widowed females account for as high as 53.9percent while widowed males account for 6.6percent.Among the married, 82.5percent have no education while about 27.3 percent of the unmarried have never been to school. More than eight in ten of the married population(85.9 %) is employed,1.1percent are unemployed and 13percent are economically not active. A greater proportion of those who have never married (52.7%) are economically not active with 1.2 percent unemployed.
Nationality. The proportion of Ghanaians by birth in the District is 92.8percent. Those who have naturalised constitute one percent and non-Ghanaian 0.9 percent.
Literacy and education. Of the population 11 years and older, 40.0 percent are literate and 60.0 percent are non-literate. The proportion of literate males is higher (47.1%) than that of females (36.0%). About two out of ten people (19.3%)indicated they could read and write both English and Ghanaian languages. Of the population aged 3 years and above18,145 in the District, 50.7percent have never attended school, 40.1percent are currently attending and 9.2percent have attended in the past.
Economic Activity Status. About 74.7 percent of the population aged 15 years and older is economically active while25.3 percent are economically not active. Of the economically active population,98.3 percent are employed whilst less than two(1.7 %) percent are unemployed. For those who are economically not active, a larger percentage of them are students (48.5%), 20.3% perform household duties and 7.1percent are disabled or too sick to work. Less than four in ten(37.6 %) percent of the unemployed population are seeking work for the first time.
Occupation Of the employed population, about 82.3percent are engaged as skilled agricultural, forestry and fishery workers, 5.0 percent in service and sales, 7.2percent in craft and related trade, and 2.5 percent are engaged as managers, professionals, and technicians.
Employment status and sector. Of the population 15 years and older 55.8percent are self–employed without employees, 36.6 percent are contributing family workers,1.1percent are casual workers and 0.4 percent are domestic employees (house helps). Overall, men constitute the highest proportion in each employment category except the contributing family workers and apprentices. The private informal sector is the largest employer in the District,employing 96.3 percent of the population followed by the public sector with 2.6percent.
Information Communication Technology. Of the population 12 years and above, 14.4percent have mobile phones. Men who own mobile phones constitute 22.3percent as compared to 7.4 percent of females. Less than one (0.5%)percent of the population12 years and older use internet facilities in the District. Only 51 households representing 0.7percent of the total households in the District have desktop/laptop computers.
Disability. About 3.5percent of the District’s population has one form of disability or the other.The proportion of the male population with disability is slightly higher (3.6%) than females (3.5%). The types of disability in the District include sight, hearing, speech, physical, intellect,other and emotion. Persons with ‘other’ disability recorded the highest of 27.6 percent followed by Sight disability (25.7%). About 30percent of the population with disability is in the rural localities. There are more females with other, sight, physical and emotional disabilities than males in the rural locality. Of the population disabled, 68.2percent have never been to school, with 39.4 percent not economically active.
Agriculture. As high as91.8 percent of households in the District are engaged in agriculture while 8.2 percent representing are households not engaged in any agricultural activity. Most households in the District (98%) are involved in crop farming. Poultry (chicken) is the dominant animal reared in the District.
Housing. The housing stock of Sissala West District is 5,185 representing 6.3 percent of the total number of houses in the Upper West Region. The average number of households per house is1.4. Type, tenancy arrangement and ownership of dwelling units Rooms in compound houses are the most dominant type of dwelling unit occupied by households and this constitute more than half of all dwellings in the District (58.6%) with separate houses constituting 27.4 percent of all dwelling types. More than three quarters(94.3%) of the dwelling units in the District are owned by members of the household; 1.8 percent is owned by private individuals; 1.7 percent is owned by a relative who is not a member of the household and only 1.1percent is owned by public or government. Less than one percent (0.7%) of the dwelling units is owned through mortgage schemes.Material for construction of outer wall, floor and roofThe main construction material for outer walls of dwelling units in the District is mud/mud bricks or earth accounting for 83.8 percent with cement/concrete constituting 9.7 percent of outer walls of dwelling units in the District. Cement (63.5 %) and mud/earth (34.1%) are the two main materials used in the construction of floors of dwelling units in the District. Metal sheets are the main roofing material (66.7%)for dwelling units in the district. Room occupancy One room constitutes the highest percentage(55.0%)of sleeping rooms occupied by households in housing units in the District. About 87.5percent of households with 10 or more members occupy single rooms.Utilities and household facilities The three main sources of lighting in dwelling units in the District are flashlight/torch (46.5 %), electricity (41.9%) and kerosene lamp (5.9 %). The main source of fuel for cooking for most households in the district is wood (87.5 %). The four main sources of water in the district are borehole, river stream, public tap and pipe borne water. More than eight in ten of households (87.5 %) drink water from boreholes. A greatproportion, (74.8 %) of households in the district does not havetoilet facility. They either use the bush or fieldfor such purposes. In effect, pit latrine (14.2 %) public toilet (3.7 %),KVIP (5.2 %) and the WC (0.8 %) are the main types of toilet facilitiesusedby households..On the other hand more than three–quarters (79.9 %) of households hasone kind of bathing facility or the other.These are: own bathroom for exclusive use (42.9 %), shared separate bathroom in the same house (19.2 %), private open cubicle (7.3 %), and private shared cubicle (10.7 %). The proportions of households who use public bathhouse are 2.4 percent and those who use bathroom in another house are 1.3 percent.
Waste disposal. The most widely method of solid waste disposal isby public dump in the open space accounting for close to 50percent (46.6%). About three in ten households (35.2%)dump their solid waste indiscriminately. House to house waste collection accounts for 1.1 percent.For liquid waste disposal, throwing waste onto the street/ outside 58.7%) and onto the compound (25.3%) are the two most common methods usedby households in the district
Our Leadership
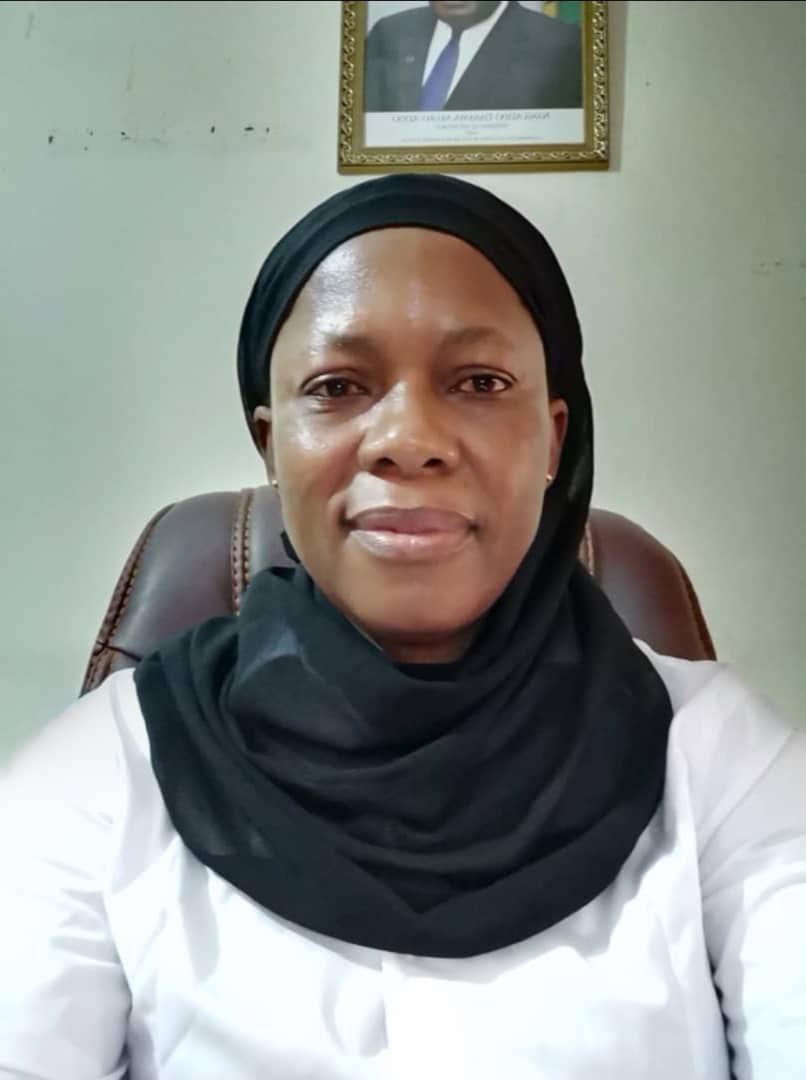
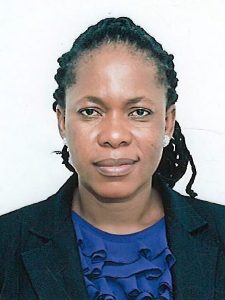
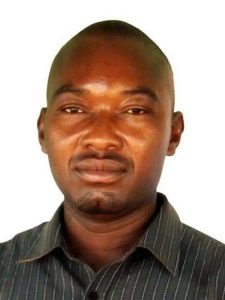
Hon. Ayisha Imoru Batong Hor
District Chief Executive
Hon. Ayisha Imoru Batong Hor
District Chief Executive, SWDA
Date of Birth: 27th April, 1974
Home Town: Sangbaka, Sissala West
Married to Daniel Batong Hor
Blessed with four children
Course of Study: B. Com (Accounting option)
African Development Educator (ADE)
Profession: Banker
Last work place: Tumu Co-operative Credit Union
Position: CEO

Mr. Abubakari Musah
District coordinating Director
Educational Background:
KNUST, Masters in Public Administration
UG, Bachelor of Arts
TATCO, P/s Teacher Certificate
Bimbisec, GCE O’ Level
Work Experience
Ag. DCD, Wa West DA
Upper West RCC, Assistant Dir
Garu Tempani DA, Assistant Dir
Bolgatanga MA, Assistant Dir
Builsa DA, Assistant Dir